Modern applications, from e-commerce platforms to fintech systems, are built on microservices, APIs, containers, and cloud-native infrastructure. While this architecture enables agility and scalability, it also introduces operational complexity.
When issues arise in production, traditional logging and basic monitoring tools often fail to provide the depth required to diagnose and resolve problems efficiently.
This is where application observability becomes essential.
What Is Application Observability?
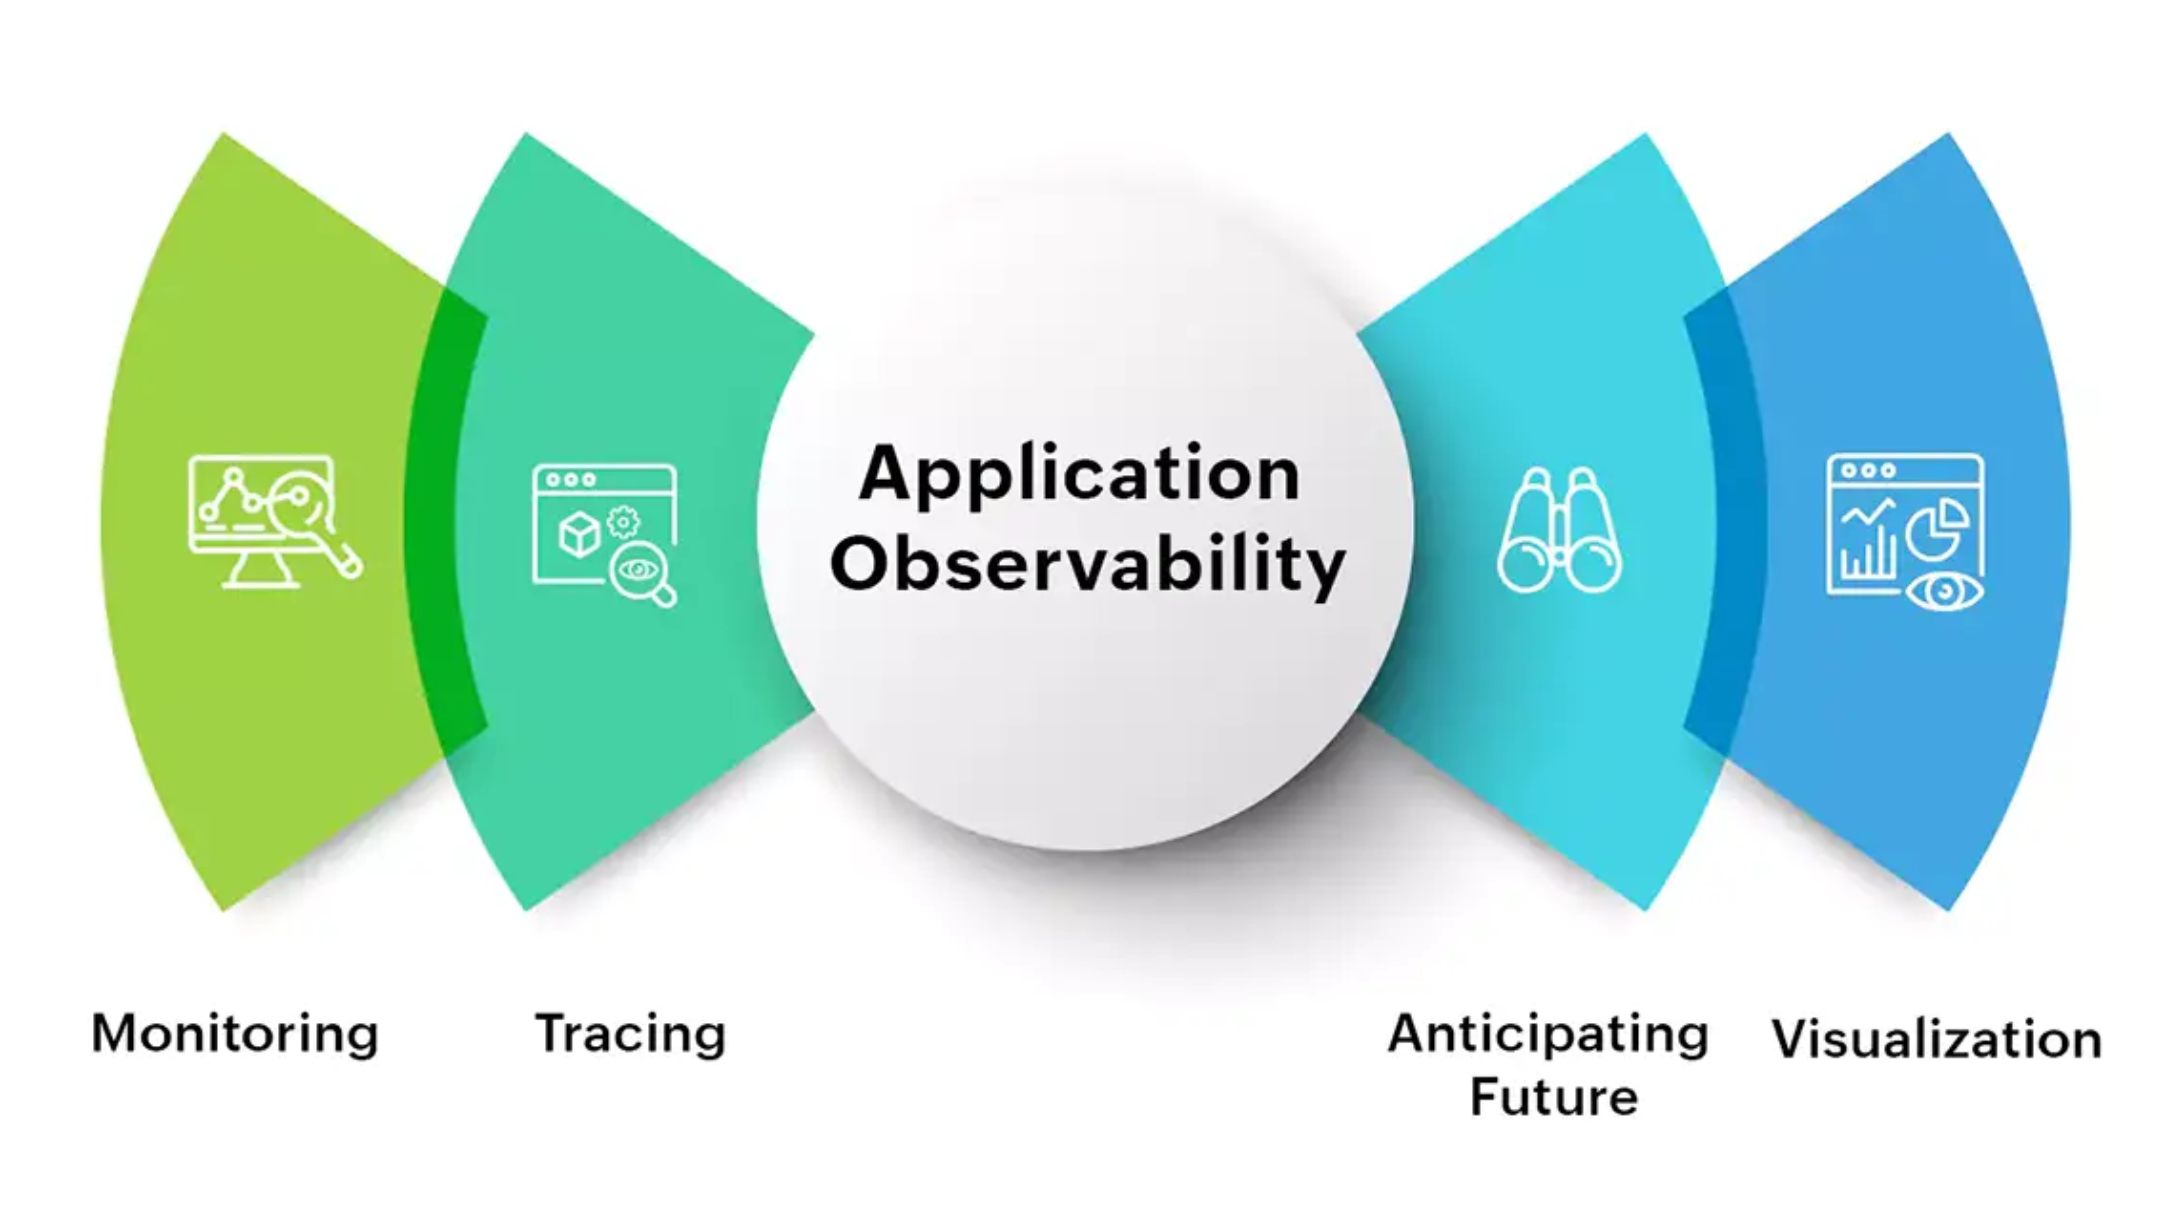
Application observability is the ability to measure, monitor, and understand the internal state of an application by analyzing the telemetry it emits.
Unlike infrastructure monitoring, application observability focuses on:
Application performance
Request paths and execution flow
Code-level errors and exceptions
Business logic visibility (user actions, transactions, feature usage)
It enables teams to answer critical questions such as:
What caused the spike in application latency?
Why did a specific transaction fail?
How is a newly deployed feature performing across user segments?
Observability shifts teams from reacting to symptoms to understanding root causes.
Observability vs. Monitoring
Monitoring and observability are not the same.
Feature
Monitoring
Observability
Primary goal
Know if something is wrong
Understand why something is wrong
Data collected
Predefined metrics and logs
Rich telemetry (logs, metrics, traces)
Question type
Answers known/predefined questions
Answers novel or unknown questions
Approach
Reactive (alerts based on thresholds)
Proactive (explores system behavior and unknowns)
Core Telemetry for Observability
Effective observability relies on three key telemetry types:
Application Logs – Capture discrete events, errors, stack traces, and custom messages. Use structured logging (JSON), metadata like trace_id, and log levels (DEBUG, INFO, WARN, ERROR).
Application Metrics – Quantify performance and health. Examples: request rate, error rate, latency, and custom business metrics like checkout success rate.
Distributed Traces – Track request flow across services to understand causality, visualize latency, and identify bottlenecks.
Instrumenting Your Application
Key components to instrument for observability:
HTTP handlers: Capture request/response, headers, status codes, and durations
Database queries: Track latency, frequency, slow queries, and errors
External dependencies: Monitor API calls, caching, and third-party services
High-cardinality label management: Control or sample label values to avoid overload
Benefits of Application Observability
Debugging: Trace errors across complex services
Incident response: Detect anomalies early
Performance optimization: Identify bottlenecks
Feature rollouts: Track real-time impact
Compliance: Audit user/system actions
Challenges to Address
Performance overhead from excessive instrumentation
High telemetry volume → costs & complexity
Log noise → hard to identify critical events
Lack of telemetry correlation → fragmented insights
Best Practices
Use OpenTelemetry or vendor-neutral tools to avoid lock-in
Ensure consistent trace ID propagation
Avoid logging sensitive data or PII
Sample high-volume traces intelligently
Review and refine dashboards & alerts regularly
Embracing Observability for Reliable Systems
Application observability is a necessity for modern systems. By instrumenting applications for structured, context-rich telemetry, teams can detect, troubleshoot, and resolve issues proactively, improving uptime, performance, and user experience.
Application Observability with ManageEngine Applications Manager